Introduction: In the data-driven world of YouTube, views are a vanity metric. You can buy views, you can get lucky with a click, but you cannot fake retention. Audience retention is the single most important metric for long-term channel growth. It tells you not just how many people clicked, but how many people actually cared enough to stay. It is the direct feedback loop between your creative vision and your audience's attention span. If you want to master the algorithm, you must first master the art of keeping eyes on the screen. This comprehensive guide will teach you how to read your retention graphs like a pro, identify the exact moments where you lose viewers, and engineer your content to maximize watch time.
Welcome to our comprehensive deep dive. In this article, we are going to explore the critical mechanics that power digital growth. Today's landscape requires creators to understand not just content creation, but distribution, analytics, link routing, and audience psychology.
Many creators spend hours filming and editing, only to neglect the final step: distribution. When sharing links on external platforms like Instagram, TikTok, or Twitter, sending users to standard URLs often traps them in an in-app browser. This kills engagement instantly. Deep linking solutions like OpeninYoutube are specifically engineered to bypass these sandboxes, ensuring your audience lands securely in their native app where they are already logged in and primed to interact.
The Anatomy of the Retention Graph
When you open YouTube Studio and look at the retention graph, you see a line that starts high and ends low. But every dip, spike, and curve tells a story. To master retention, you need to understand the three key phases of the graph.
The Intro (0:00 - 0:30)
The steepest drop usually happens here. This is where viewers decide if your video delivers on the promise of the thumbnail. A sharp drop here means your intro is too long, your audio is bad, or you aren't getting to the point fast enough. Your goal is to keep at least 70% of viewers past the 30-second mark.
The Body (The Flat Line)
After the intro, the line should stabilize. This is your "engagement zone." If the line is flat or slowly declining, you are doing well. If it looks like a staircase with sharp drops every minute, your pacing is off. You are losing viewers in chunks, which suggests boring segments or confusing transitions.
The Outro (The Cliff)
Every video has an end, but a steep cliff at the end means people are leaving before you finish. This is a missed opportunity to drive session time. If people leave early, they aren't clicking your end screens or watching your next video.
Diagnosing the Drop-Offs
The magic of YouTube Analytics is the ability to click on specific points of the graph and replay that exact moment in your video. This is your diagnostic tool.
Identifying the "Boring" Moments
Click on a sharp dip. What is happening? Are you rambling? Is there a long pause? Did you start a long backstory that isn't relevant? Often, creators fall in love with their own footage and forget to edit ruthlessly. If a segment doesn't advance the story or provide value, cut it. Be brutal.
Technical Glitches
Sometimes the drop isn't content; it's technical. Was the audio suddenly too quiet? Did the video quality drop? Did an ad break happen at a crucial moment? Check the technical quality of the video at the drop-off point. Fixing audio levels alone can save you 5-10% retention.
Key Insight: Look for Spikes too! A spike means people re-watched a section. Why? Was it a funny joke? A complex explanation? A cool visual effect? Identify what caused the spike and do more of that in future videos.
The Power of Relative Retention
Absolute retention (e.g., "40% average view duration") is good, but Relative Retention is better. This metric compares your video to other YouTube videos of the same length. It tells you if you are performing above or below average.
If your relative retention is "Above Average," YouTube will push your video harder because it knows your content is more engaging than the competition. Aim to be in the top 10% of videos in your niche. This metric strips away the bias of video length and focuses purely on engagement quality.
Editing for Retention
Retention isn't just about what you say; it's about how you show it. Modern audiences have been trained by TikTok and Shorts to expect constant stimulation. You don't need to be hyper-active, but you do need to respect their attention span.
Pattern Interrupts
Change the visual state every 5-15 seconds. This could be a B-roll cut, a text overlay, a zoom, or a sound effect. These "interrupts" reset the viewer's attention clock and prevent them from zoning out.
Sound Design
Bad audio is the #1 reason people click away. Ensure your voice is crisp, loud, and consistent. Use background music to set the mood, but duck it (lower the volume) when you speak. Silence can also be powerful; use it to emphasize a dramatic point.
The J-Cut and L-Cut
Use advanced editing techniques like J-Cuts (audio from the next scene starts before the video cuts) and L-Cuts (video cuts to the next scene while audio from the previous scene continues). These create a seamless flow that keeps the viewer immersed in the narrative without noticing the edits.
External Traffic & Friction
Your retention graph includes traffic from all sources, including external links from social media. This is where many creators unknowingly sabotage their own metrics.
The Mobile Browser Trap
When you share a standard YouTube link on Instagram or Twitter, it often opens in a slow, internal web browser. The user isn't logged in, the player is clunky, and they might have to log in to continue watching. Many simply give up and close the tab. This counts as a "view" with 0 seconds of watch time, tanking your average retention.
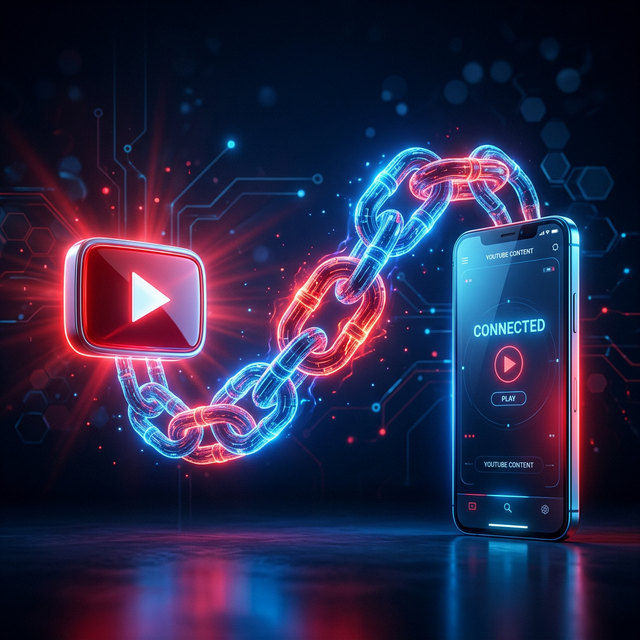
The Deep Link Solution
To fix this, you must use Deep Linking. Tools like OpeninYoutube generate smart links that detect the user's device. When a fan clicks your link on social media, it bypasses the browser and opens the video directly in the native YouTube app.
- Instant Load: No buffering, no login walls.
- Higher Retention: App viewers are logged in and ready to watch, leading to much higher average view durations.
- Better Algorithm Signal: High retention from external traffic tells YouTube to push your video to more internal users.
By removing this technical friction, you ensure that every external view contributes positively to your retention graph rather than dragging it down.
Conclusion
Understanding audience retention is the key to unlocking viral growth. It transforms you from a creator who guesses to a creator who knows. By analyzing your graphs, diagnosing drop-offs, editing for engagement, and ensuring your distribution links are frictionless, you can systematically improve every single video you make.
Don't be afraid of the data. Embrace it. Let the graph tell you what your audience wants, and then give it to them. Combine high-retention content with smart distribution tools like deep linking, and you will build a channel that not only gets views but keeps them watching. Start auditing your latest video today. Find the drop, fix the leak, and watch your retention soar.